Live Performance, Jan–May 2026
A periodic update on the live performance. Our book currently consists of a cross-sectional portfolio sub-strategy and a directional bias in the form of a momentum strategy, which over the past five months ran at equal weight — 0.65 each. The book is up ~+5% while Bitcoin fell 17% and Ethereum fell 33%.
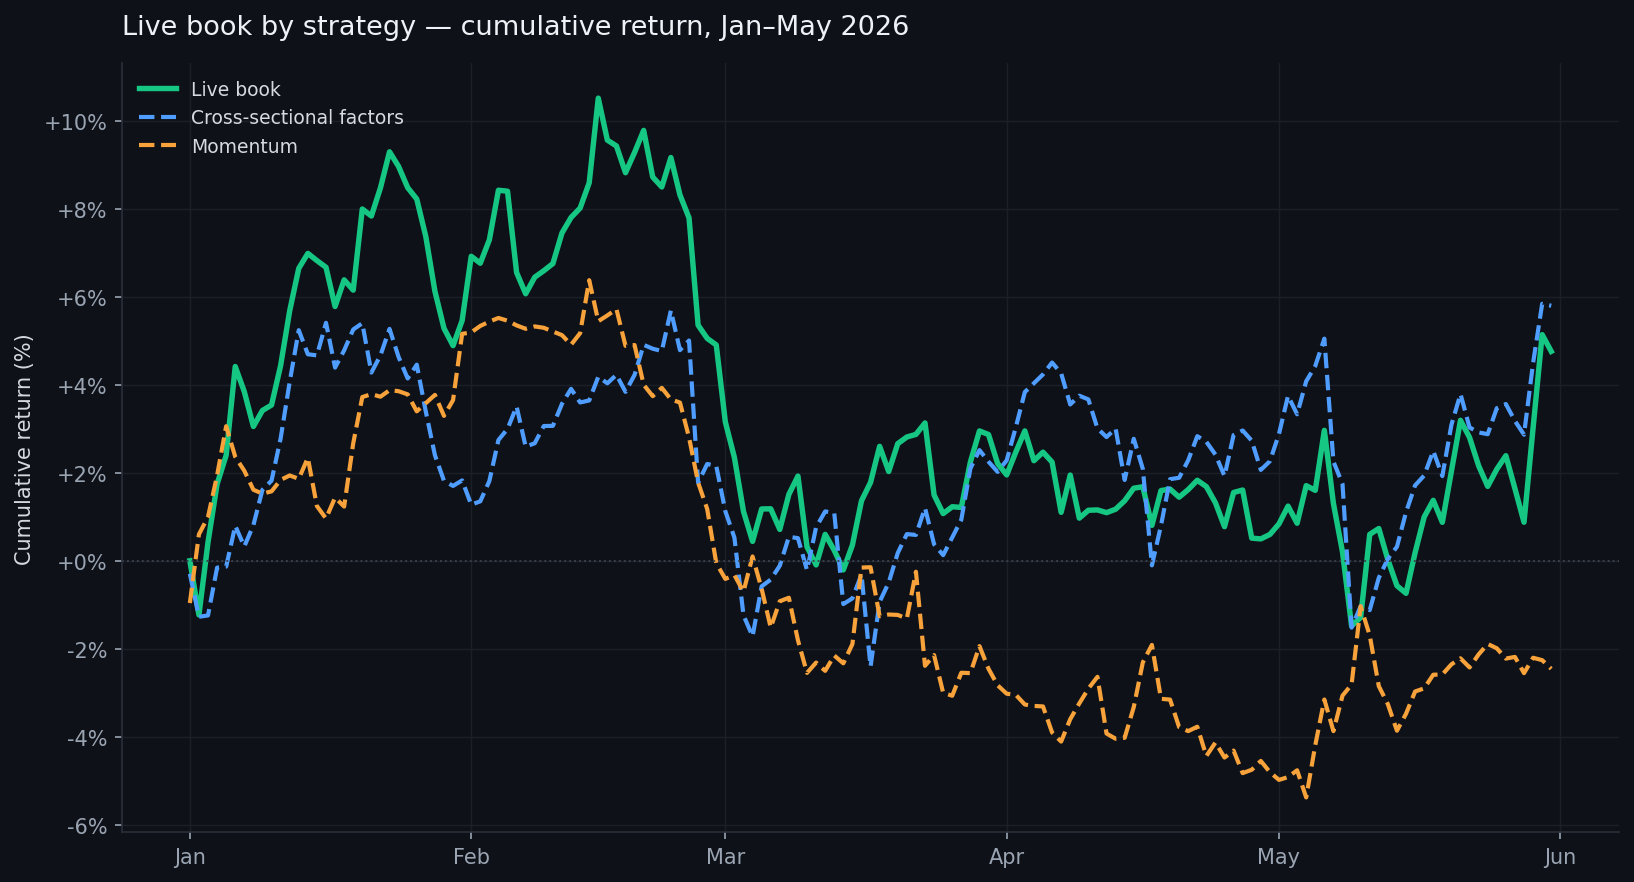
| Series | Total return | Ann. vol | Max drawdown |
|---|---|---|---|
| Live book | +4.8% | 15.4% | −10.9% |
| Cross-sectional factors | +5.8% | 15.3% | −7.7% |
| Momentum | −2.5% | 11.8% | −11.1% |
Insights
In March and May the cross-sectional strategy took sudden losses on several occasions, usually when a low-cap asset spiked hard — 20%, 30%, even 50% moves in names like WLD, NEAR, or TON, sometimes on the back of fundamental news.
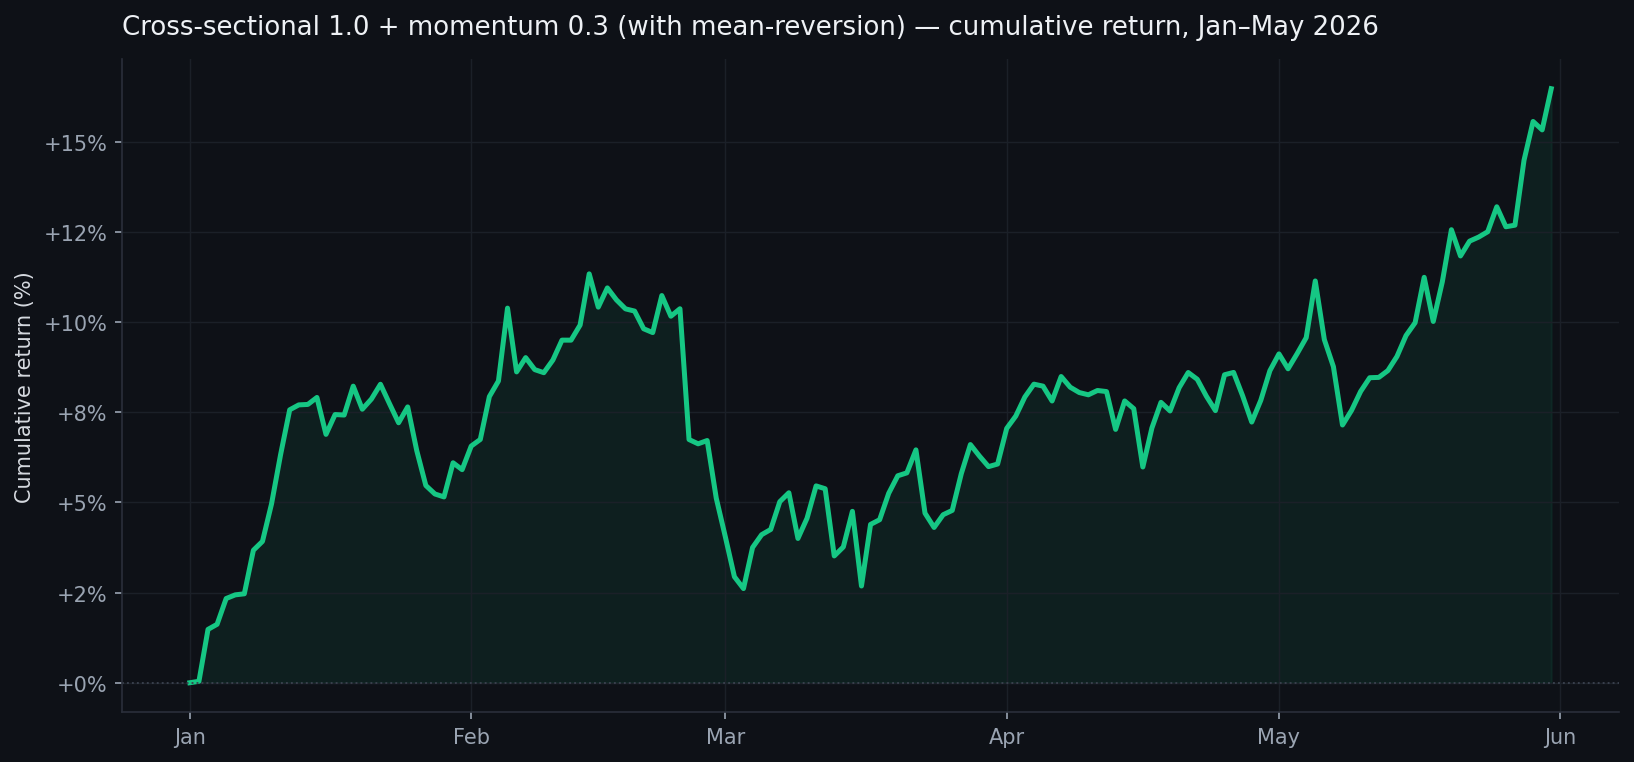
The factor set has no sentiment factor yet, which could have cushioned some of this. A mean-reversion factor would also have helped: in backtesting it partially offsets these episodes and slightly improves the equity curve — which is why we are adding it.
Leaning Into Cross-Sectional
Since we launched the cross-sectional portfolio strategy in September 2025, these nine months of live operation have given us a much better understanding of it and more confidence in the methodology. It now combines six factors, each built from multiple features.
Trend has been weak of late. It will return at some point, but we no longer want to lean on it as heavily as before: from June we are shifting to 1.0 weight on the cross-sectional portfolio and 0.3 on momentum. Backtested over the same five months — with the mean-reversion factor included, and net of fees and potential execution slippage — that 1.0 / 0.3 configuration would have delivered around 17%.
Beyond the mean-reversion factor above, we are working on a few more derived from liquidations data, crypto options, and order-book depth:
- Liquidations play a major role — perhaps the biggest — in perps trading; signals derived from them show good predictability over mid-length horizons.
- Options are forward-looking by design. The constraint is coverage — only 5–7 assets carry a usable surface — which limits their use, though they remain interesting.
Methodology: the live book is the realised return; the strategy lines decompose it into the cross-sectional factors and momentum allocations at their book weight. Market figures are spot reference prices.